10. Employment Relations
This section sets out the number of cases where formal proceedings were taken that led to formal sanctions or the employee’s resignation under the Councils Disciplinary, performance and absence procedures and formal grievances.
There were 31 cases managed under these procedures shown by personal characteristic below, 23 of these were disciplinaries, capabilities and sickness absence, the final 8 were grievances.
| Ethnicity | Amount (%) |
|---|---|
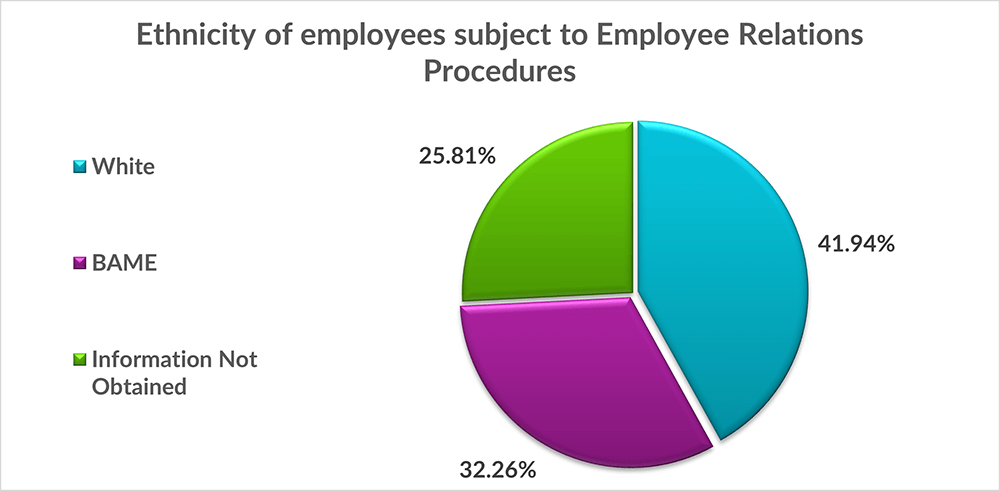
| White | 41.94% |
| BAME | 32.26% |
| Information Not Obtained | 25.81% |
Total of formal proceedings cases by ethnicity pie chart
Total of formal proceedings cases by ethnicity pie chart figures
Chart showing that 41.94% of the Employee Relation Procedures were for people with a White ethnicity compared to 32.26% who were BAME.
| Disability/incapacity | Amount (%) |
|---|---|
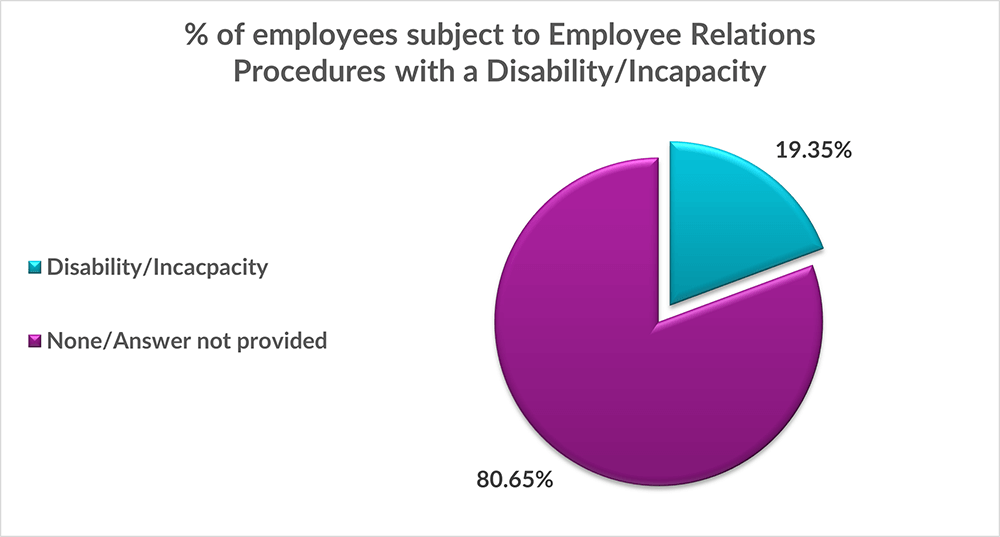
| Disability/Incapacity | 19.35% |
| None/Answer not provided | 80.65% |
Total of formal proceedings cases by disability/incapacity pie chart
Total of formal proceedings cases by disability/incapacity pie chart figures
Chart showing that 19.35% of staff who had a Employee Relation Procedure had a Disability/Incapacity.
| Gender | Amount (%) |
|---|---|
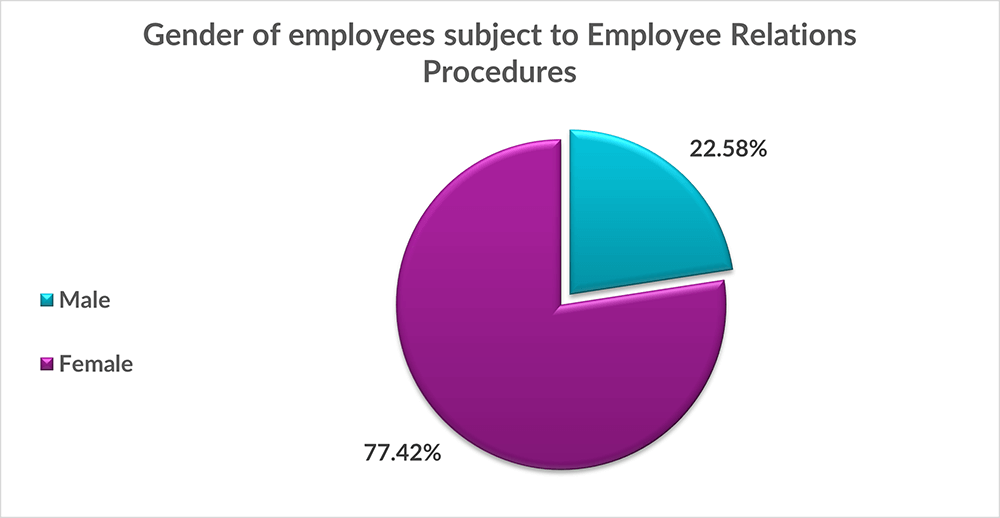
| Male | 22.58% |
| Female | 77.42% |
Total of formal proceedings cases by gender pie chart
Total of formal proceedings cases by gender pie chart figures
Chart showing that 77.42% of Employee Relation Procedures were for Females compared to 22.58% Male's.
| Age Profile | Amount (%) |
|---|---|
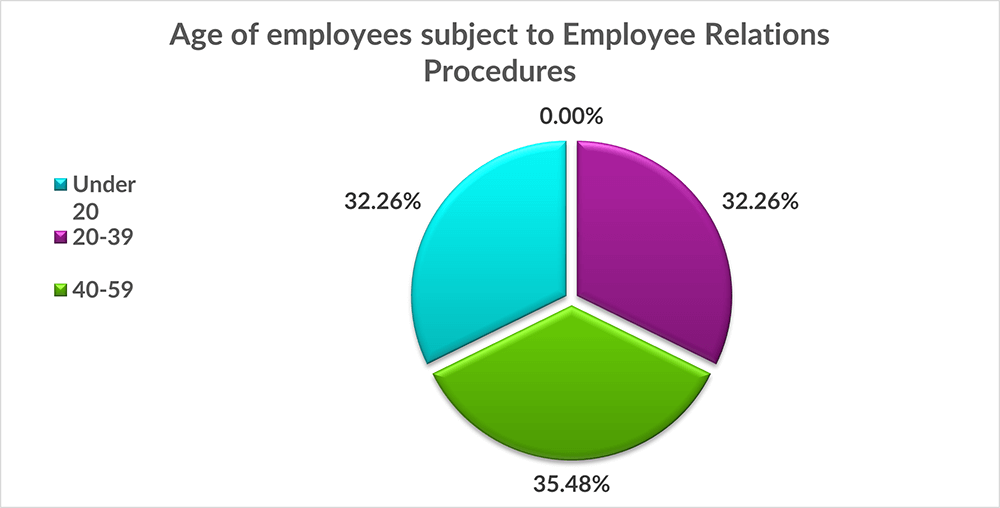
| Under 20 | 0.00% |
| 20-39 | 32.26% |
| 40-59 | 35.48% |
| 60+ | 32.26% |
Total of formal proceedings cases by age pie chart
Total of formal proceedings cases by age pie chart figures
Chart showing that the age range 40-59 had the highest amount (35.48%) compared to the lowest Under 20's (0%).
| Sexual Orientation | Amount (%) |
|---|---|
| Heterosexual | 67.74% |
| Gay/Lesbian/Bi-Sexual | 6.45% |
| Not Given/Prefer Not to Say | 25.81% |
Total of formal proceedings cases by sexual orientation pie chart
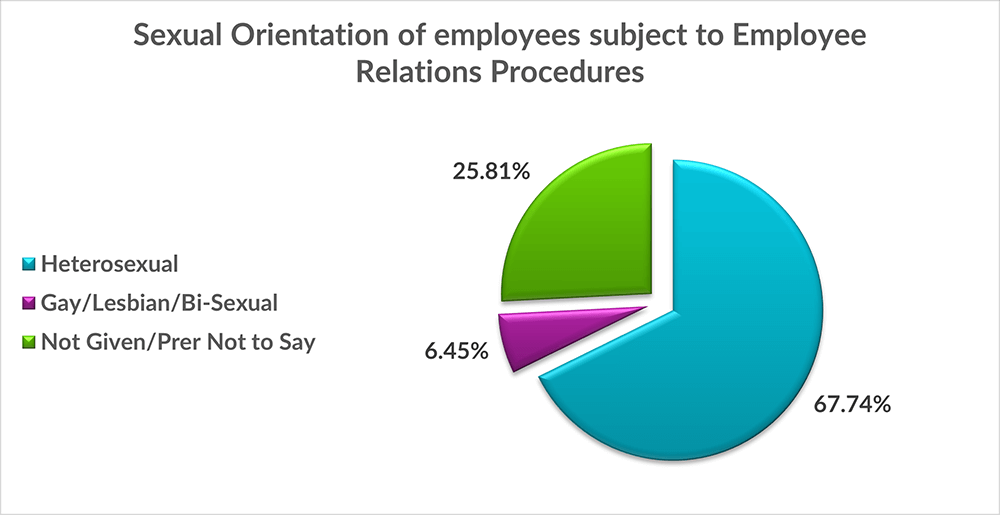
Total of formal proceedings cases by sexual orientation pie chart figures
Chart showing that 67.74% of staff who had an Employee Relations Procedure were Heterosexual, followed by 25.81% who did not state their orientation and 6.45% of the staff were non-heterosexual.
| Religion | Amount (%) |
|---|---|
| Christian | 51.61% |
| Buddhism, Hinduism, Islam (Muslim), Jehovah’s Witness, Judaism, Sikhism (Other Religion) | 16.13% |
| Not Given/None | 32.26% |
Total of formal proceedings cases by religion pie chart
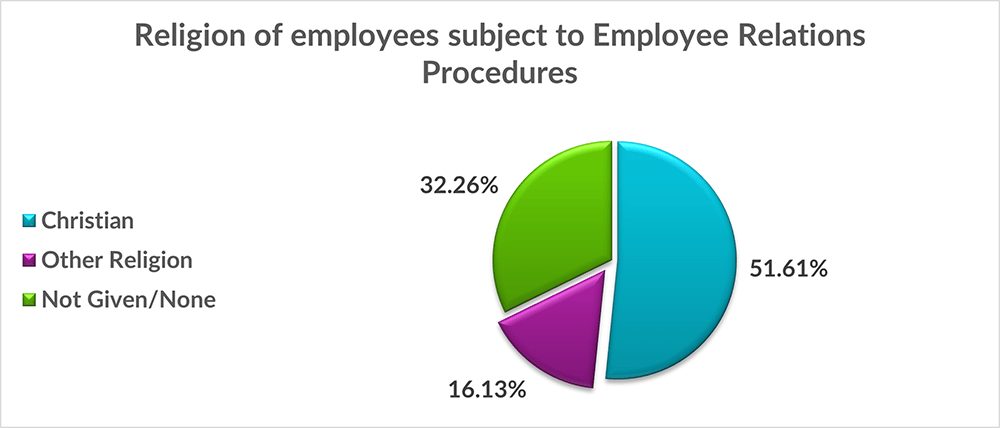
Total of formal proceedings cases by religion pie chart figures
Chart showing that a total of 32.26% did not state their religion or don't have one, followed by Christianity at 51.61% .