
Specialist analysis of the current Selective Licensing scheme
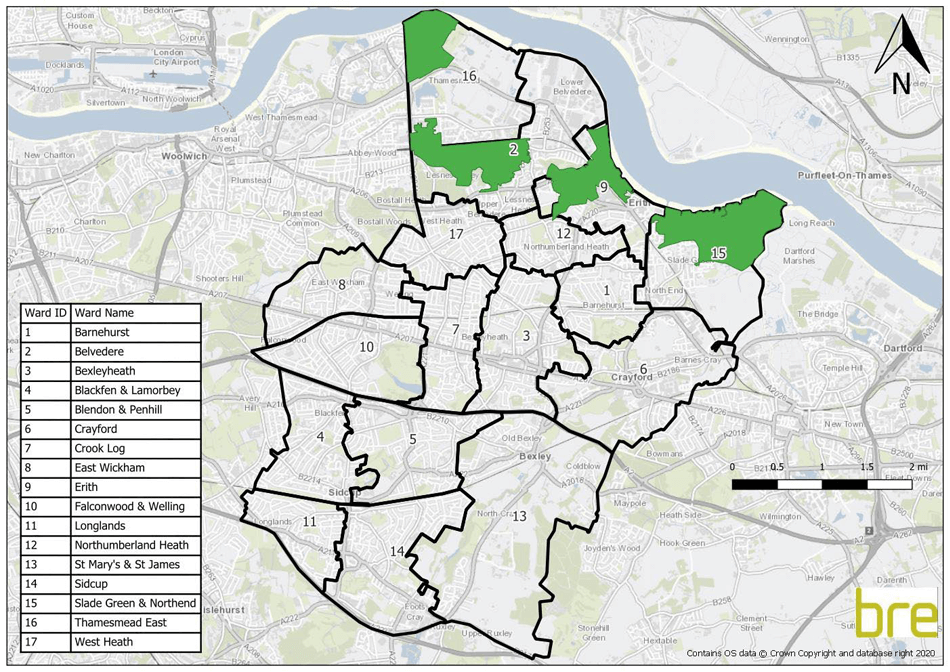
The London Borough of Bexley has four areas that are covered by the current Selective Licensing scheme - Thamesmead North, Abbey Wood/Lower Belvedere, Erith and Manor Road, all of which are show in green in Map 1. The designation came into force on 1 October 2018 and is due to cease on 31 August 2023.
To understand the impact of the scheme on HHSRS category 1 hazards in the relevant areas, a ‘before and after’ analysis was conducted.
Map 1
Locations of the four Discretionary Licensing schemes. The Thamesmead North scheme is within the Thamesmead East ward, the Abbey Wood/Lower Belvedere scheme is within the Belvedere ward, the Erith scheme is within the Erith Ward and the Manor Road scheme is within the St Mary’s and St James ward.
*The below image of Map 1 is not suitable for users of assistive technology (Screen reader) and does not allow users to zoom in without degrading visual quality. If you would like to understand any details about this map, please email rentitright@bexley.gov.uk
Local Authority level results
The baseline levels of category 1 hazards spilt by tenure, are shown in Table 1 where it is the owner occupied sector that has the highest proportion of category 1 hazards. Table 2 shows the levels of category 1 hazards spilt by tenure, following mitigation of hazards. This shows very slight reductions in all three tenures, however, these reductions are not significant enough to affect the overall percentage of dwellings that contain a category 1 hazard.
Table 1 - Category 1 hazards spilt by tenure, for Bexley (baseline)
| Bexley (baseline) | Dwelling total | Number (and %) category 1 hazards |
|---|---|---|
| Owner occupied | 65,325 | 6,335 (10%) |
| Private rented | 20,497 | 1,682 (8%) |
| Social | 15,567 | 690 (4%) |
| Total | 101,389 | 8,707 (9%) |
Table 2 - Category 1 hazards spilt by tenure, for Bexley (current)
| Bexley (baseline) | Dwelling total | Number (and %) category 1 hazards |
|---|---|---|
| Owner occupied | 65,325 | 6,243 (10%) |
| Private rented | 20,497 | 1,616 (8%) |
| Social | 15,567 | 681 (4%) |
| Total | 101,389 | 8,540 (9%) |
To understand the impact the discretionary licensing scheme has had on HHSRS category 1 hazards in the relevant areas, the next section provides maps showing the baseline and current levels of category 1 hazards in the private rented sector, as well as the counts of dwellings where hazards have been mitigated.
Census Output Area (COA) level results
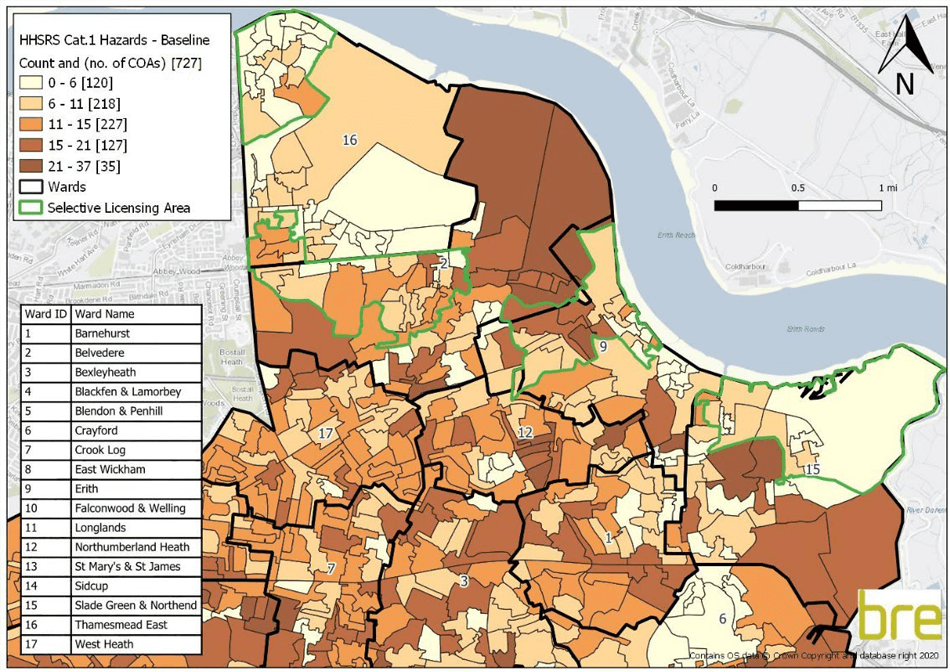
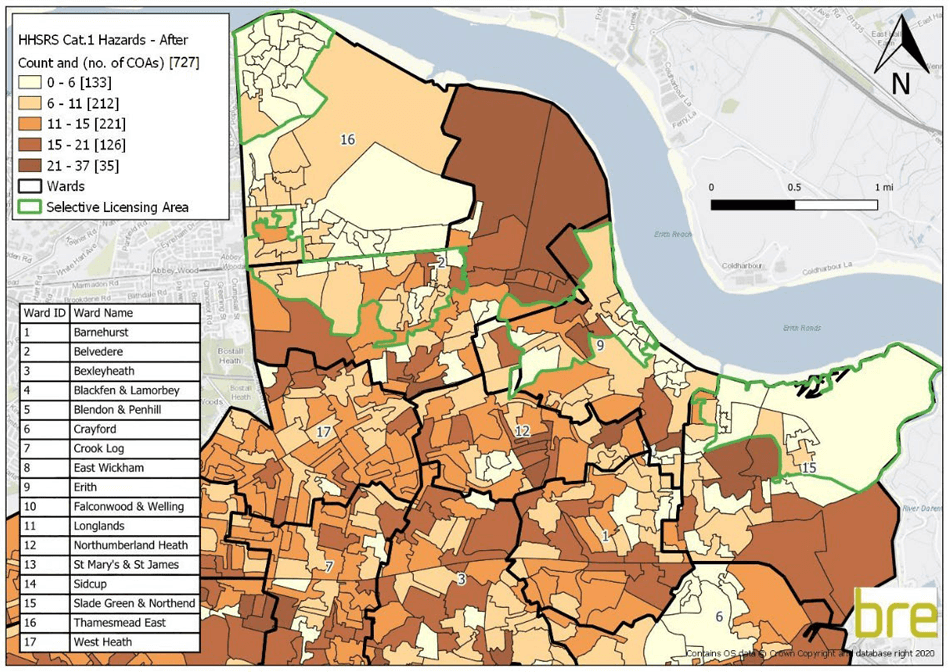
Map 2 and Map 3 show the distribution of HHSRS category 1 hazards in the private rented sector before and after mitigation work, respectively. The maps show a reduction in category 1 hazards in all four of the licensed areas.
In Thamesmead East, the levels of category 1 hazards have reduced in the centre and southeast of the designated area. In Abbey Wood/Lower Belvedere lower levels of category 1 hazards are found towards the northeast, south and east of the designated area. In Erith lower levels of category 1 hazards can be seen in parts of the southeast, the west and the southwest of the designated area and in Manor Road lower levels of category 1 hazards can be found in the east of the designated area.
Map 2
Distribution of estimated percentage of dwellings with HHSRS category 1 hazards before mitigation work, private rented sector
*The below image of Map 2 is not suitable for users of assistive technology (Screen reader) and does not allow users to zoom in without degrading visual quality. If you would like to understand any details about this map, please email rentitright@bexley.gov.uk
Map 3
Distribution of estimated percentage of dwellings with HHSRS category 1 hazards after mitigation work, private rented sector
*The below image of Map 3 is not suitable for users of assistive technology (Screen reader) and does not allow users to zoom in without degrading visual quality. If you would like to understand any details about this map, please email rentitright@bexley.gov.uk
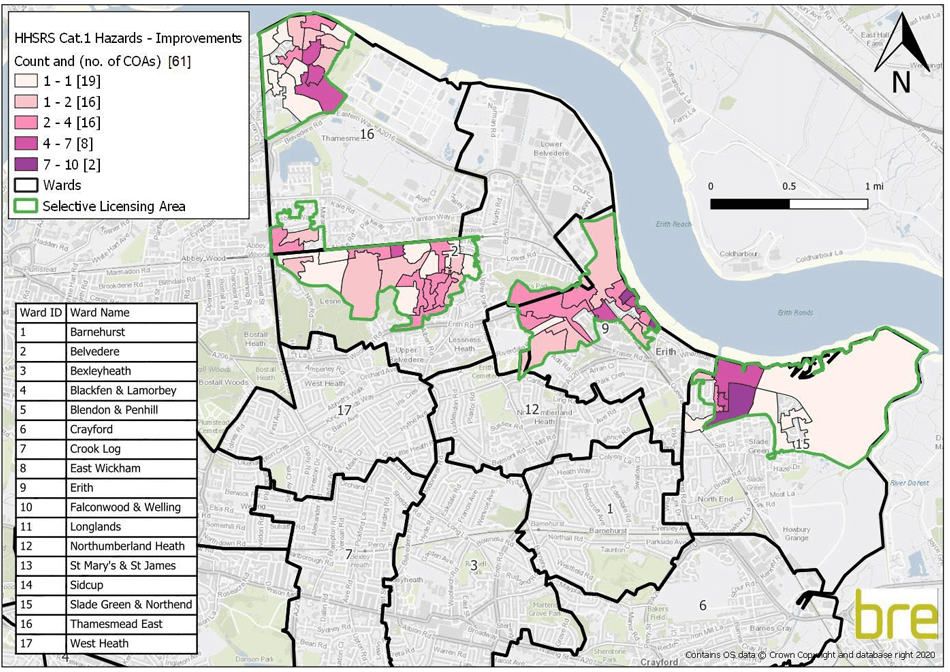
Map 4
Map 4 shows the distribution of the number of dwellings where category 1 hazards were mitigated and highlights that most LSOAs within the designated areas have seen a slight improvement in the levels of category 1 hazards. However, there is one LSOA within the Erith scheme and another LSOA within the Manor Road scheme where a significant improvement has been made to the number of dwellings with a category 1 hazard.
Distribution of number of dwellings where HHSRS category 1 hazards were mitigated, private rented sector.
*The below image of Map 4 is not suitable for users of assistive technology (Screen reader) and does not allow users to zoom in without degrading visual quality. If you would like to understand any details about this map, please email rentitright@bexley.gov.uk
Noise Nuisance within Bexley
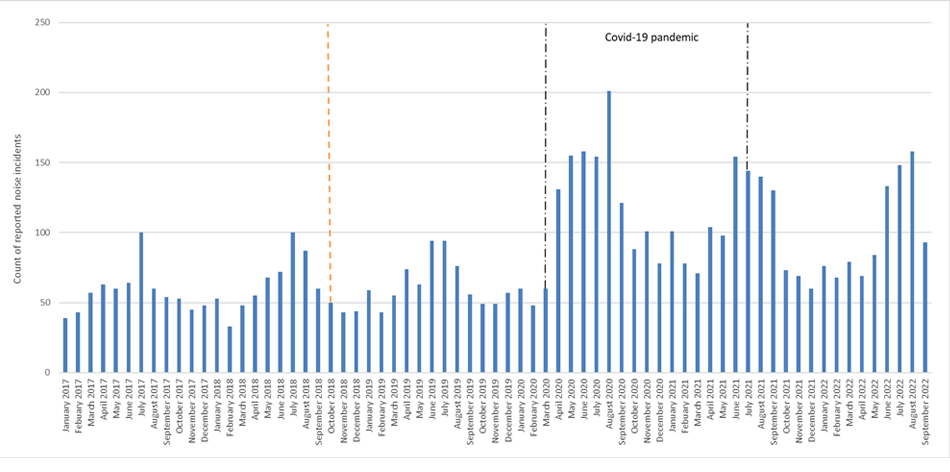
In relation to the noise nuisance data provided by the council, Figure 1 shows the count of reported noise incidents between January 2017 and September 20233, with the selective licensing scheme being introduced in October 2018. This shows that the levels of reported noise incidents increased during the summer months and decreased during the winter months, which is typical for noise disturbance as people tend to be outside for longer periods during the day in the summer, however, it does not show any indication that instances of noise disturbance decreased with the introduction of the scheme.
This graph also spans the dates during which the Covid-19 outbreak occurred across the world and the UK went into lockdown, with the blue lines in the graph indicating the period during which national lockdowns occurred. The increase in ASB incidents during the pandemic was a nationwide problem and during these periods the National Police Chiefs’ Council found that this could be in part attributable to noise nuisance4. However, in relation to the efficacy of the Selective Licensing scheme, the graph does not indicate that levels of noise nuisance have been decreasing since the introduction of the scheme and this may be a result of the impact of the lockdowns during the pandemic meaning that the picture is unclear due to the influence of such an event.
Figure 1
Count of reported noise incidents per month between January 2017 and September 2022. The orange dashed line indicates when the scheme was introduced (October 2018) and the two dash dot lines indicate when the Covid-19 lockdowns started (March 2020) and finished (July 2021).
*The below image of Figure 1 is not suitable for users of assistive technology (Screen reader) and does not allow users to zoom in without degrading visual quality. If you would like to understand any details about this figure, please email rentitright@bexley.gov.uk
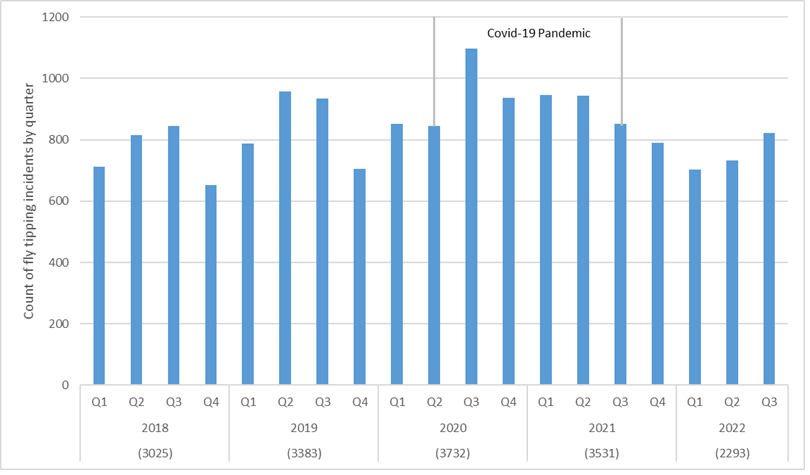
By also showing the count of reported noise incidents per quarter (by calendar year) in Figure 2, the impact of the pandemic becomes clearer, as instances of noise disturbance are especially high in Q2 and Q3 of 2020. The number in brackets beneath the year in the figure shows the total number of noise nuisance instances for that particular year, where it is evident that for 2020, 2021 and 20225 the numbers are noticeably higher than for 2017 to 2019.
Figure 2
Count of reported noise incidents per quarter (based on calendar year) between Q1 2017 and Q3 2022. The figure in brackets beneath the year is the total number of noise incidents for that year.
| Year | Quarter | Incidents |
|---|---|---|
| 2017 | Q1 | 139 |
| 2017 | Q2 | 187 |
| 2017 | Q3 | 214 |
| 2017 | Q4 | 146 |
| 2018 | Q1 | 134 |
| 2018 | Q2 | 195 |
| 2018 | Q3 | 247 |
| 2018 | Q4 | 146 |
| 2019 | Q1 | 166 |
| 2019 | Q2 | 243 |
| 2019 | Q3 | 236 |
| 2019 | Q4 | 169 |
| 2020 | Q1 | 187 |
| 2020 | Q2 | 480 |
| 2020 | Q3 | 494 |
| 2020 | Q4 | 285 |
| 2021 | Q1 | 271 |
| 2021 | Q2 | 372 |
| 2021 | Q3 | 435 |
| 2021 | Q4 | 212 |
| 2022 | Q1 | 227 |
| 2022 | Q2 | 286 |
| 2022 | Q3 | 399 |
Given that the pandemic is likely to have influenced these figures, it is difficult to show the impact that the scheme has had on Bexley. Although this data does not show a link between the introduction of the scheme and a decrease in instances of noise nuisance, it is possible that instances of noise nuisance could have been higher had the scheme not been introduced.
Fly Tipping Within Bexley
In relation to the fly-tipping data provided by the council, Figure 3 shows the count of reported fly-tipping incidents from January 2018 until September 2022. The highest reports of incidents are in the summer months, this is to be expected as the combination of longer hours of daylight and warmer weather encourages people to spend long periods of time outdoors undertaking a variety of different activities from barbeques to DIY. This can lead to people producing waste, especially outdoors and in public spaces, therefore with more waste being produced the instances of it being dumped rather than disposed of in the correct manner becomes more common. This data also shows that during the Covid-19 pandemic instances of fly tipping were marginally higher than in the previous years, however, the increase is not particularly notable. In relation to the introduction of the selective licensing scheme, this data does not indicate that instances of fly-tipping have reduced since the start of the scheme.
Figure 3
Count of reported Fly Tipping incidents per month between January 2018 and September 2022. The orange dashed line indicates when the scheme was introduced (October 2018) and the two dash dot lines indicate when the covid-19 lockdowns started (March 2020) and finished (July 2021).
| Month/Year | Count |
|---|---|
| January 2018 | 279 |
| February 2018 | 209 |
| March 2018 | 224 |
| April 2018 | 271 |
| May 2018 | 284 |
| June 2018 | 261 |
| July 2018 | 313 |
| August 2018 | 292 |
| September 2018 | 240 |
| October 2018 | 243 |
| November 2018 | 210 |
| December 2018 | 199 |
| January 2019 | 266 |
| February 2019 | 259 |
| March 2019 | 262 |
| April 2019 | 325 |
| May 2019 | 334 |
| June 2019 | 298 |
| July 2019 | 374 |
| August 2019 | 273 |
| September 2019 | 288 |
| October 2019 | 258 |
| November 2019 | 228 |
| December 2019 | 218 |
| January 2020 | 313 |
| February 2020 | 294 |
| March 2020 | 245 |
| April 2020 | 230 |
| May 2020 | 258 |
| June 2020 | 358 |
| July 2020 | 390 |
| August 2020 | 346 |
| September 2020 | 362 |
| October 2020 | 309 |
| November 2020 | 338 |
| December 2020 | 289 |
| January 2021 | 316 |
| February 2021 | 275 |
| March 2021 | 355 |
| April 2021 | 282 |
| May 2021 | 312 |
| June 2021 | 350 |
| July 2021 | 293 |
| August 2021 | 282 |
| September 2021 | 277 |
| October 2021 | 271 |
| November 2021 | 267 |
| December 2021 | 251 |
| January 2022 | 275 |
| February 2022 | 185 |
| March 2022 | 242 |
| April 2022 | 258 |
| May 2022 | 246 |
| June 2022 | 228 |
| July 2022 | 285 |
| August 2022 | 280 |
| September 2022 | 258 |
By also showing the count of reported noise incidents per quarter (by calendar year) in Figure 4 it is clear that the pandemic has not had quite such an impact of the number of fly-tipping incidents compared to the results of the noise nuisance data. The number in brackets beneath the year in the figure shows the total number of fly-tipping instances for that particular year, where it is evident that there is a slight increase in the overall number of instances in 2020 and 2021, however, it is not especially notable.
Figure 4
Count of reported noise incidents per quarter (based on calendar year) between Q1 2017 and Q3 2022. The figure in brackets beneath the year is the total number of noise incidents for that year.
*The below image of Figure 4 is not suitable for users of assistive technology (Screen reader) and does not allow users to zoom in without degrading visual quality. If you would like to understand any details about this figure, please email rentitright@bexley.gov.uk
In a similar way to the noise data, the fly-tipping data does not show a clear decrease in the instances of fly-tipping since the scheme was introduced in October 2018, however, it is possible that the instances could have been higher had the scheme not been introduced.
Footnotes:
3 While the data provided included some information from March 2022, this was not a full month of data and therefore was not included in the analysis.
4 Local Government association - Tackling anti-social behaviour: case studies (https://www.local.gov.uk/tackling-anti-social-behaviour-case-studies)
5 Although there are only three quarters of data for 2022, the total number of noise disturbances is 912, suggesting that 2022 is likely to reach a count along the lines of 2020 and 2021.