
Specialist analysis of the Private Rented Sector
This section provides additional analysis for the private rented sector in Bexley. It covers analysis of the private rented sector, including the size of the sector and distribution of private rented dwellings, assessment of category 1 hazards and disrepair and analysis of social factors and their distribution, including deprivation and migration to aid with the council’s decision-making for future Selective Licensing schemes.
Selective Licensing is different to additional licensing as it covers all private rented sector properties (excluding any HMOs already licensed under HMO schemes). Selective Licensing must be part of the overall strategic approach taken by an authority. The main aim of Selective Licensing is to address the problems caused by poor quality private rented accommodation 6.
Section 80 of the 2004 Housing Act 7 gives powers to Local Housing Authorities (LHAs) to designate geographical areas to be licensed, provided certain conditions are met. The power does not permit LHAs to require licensing of houses that have been exempted under the Selective Licensing of Houses (Specified exemptions) (England) Order 2006, or a property that is subject to a tenancy or licence granted by a body which is registered as a social landlord under Part 1 of the Housing Act 1996. Furthermore, a local housing authority will need to apply to the Secretary of State for confirmation of any scheme which covers more than 20% of their geographical area, or that would affect more than 20% of privately rented homes in the local authority area. Prior to the introduction of a licensing scheme, there must be a consultation with residents, landlords and tenants and any others likely to be affected. If the Selective Licensing scheme is adopted, then landlords who rent out properties in that area will be required to obtain a licence from the local authority for each of their properties. Failure to do so, or if they fail to achieve minimum standards the authority can take enforcement action. More details can be found in the DCLG document 'Selective Licensing in the private rented sector: A guide for local authorities' 8.
The conditions which apply to Selective Licensing areas are split into 3 “sets”, each of which has several conditions. Any of the three sets needs to be met in order for a local authority to designate a Selective Licensing area. The requirements of each of the sets are summarised as follows:
Set one
- the area has low housing demand (or is likely to become such an area)
- Selective Licensing will contribute to the improvement of the social or economic conditions in the area, when combined with other measures taken in the area
Set two
- the area has a significant and persistent problem caused by ASB
- some or all of the private landlords letting dwellings in the area are failing to take appropriate action to combat the problem
- Selective Licensing will lead to a reduction/elimination of the problem, when combined with other measures taken in the area
Set three
- the area has a high proportion of properties in the private rented sector, compared to the total number of properties in the area – this is suggested as being the national average as reported in the latest available English Housing Survey (currently 19%) 9
- these properties are occupied under either assured tenancies or licences to occupy
- one or more of the following conditions is satisfied:
- Housing conditions - the authority has reviewed housing conditions in the area and it considers it would be appropriate for a significant number of properties in the area to be inspected to determine the presence of category 1 or 2 hazards, or the authority intends to carry out inspections with a view to carrying out enforcement action; Selective Licensing, combined with other measures, will contribute to an improvement in general housing conditions in the area
- Migration - the area has recently or is experiencing high levels of migration. A significant number of properties in the area are occupied by migrants; Selective Licensing will contribute to an improvement in the social or economic conditions in the area and ensure that properties are properly managed, and overcrowding is prevented
- Crime - the area has high levels of crime which affects those living in the area; Selective Licensing, combined with other measures, will contribute to a reduction in crime levels in the area for the benefit of those living in the area
Indicators for investigation
As detailed, there are various criteria which can be used to designate areas for Selective Licensing. The criteria which were investigated in more detail are:
- the proportion of dwellings that are privately rented
- information on property condition - the proportion of dwellings:
- with a category 1 Housing Health and Safety Rating System (HHSRS) hazard - this is the presence of one or more of the 29 hazards covered by the HHSRS1010
- with a category 1 HHSRS hazard for excess cold
- with a category 1 HHSRS fall hazard - these include those fall hazards where the vulnerable person is 60 or over i.e. the presence of falls associated with baths, falling on the level and falling on stairs
- in disrepair - this is based on the former Decent Homes Standard criteria for disrepair which states that a dwelling fails this criterion if it is not found to be in a reasonable state of repair. This is assessed by looking at the age of the dwellings and the condition of a range of building components including walls, roofs, windows, doors, electrics and heating systems
- information on deprivation based on the 2019 Indices of Multiple Deprivation (IMD) 11
- information on crime - ASB (antisocial behaviour)
- information on migration
Proportions of dwellings that are privately rented overall and by ward
The percentage of stock in Bexley which is privately rented is estimated to be 22%. This is higher than the figure for England – 19%12.
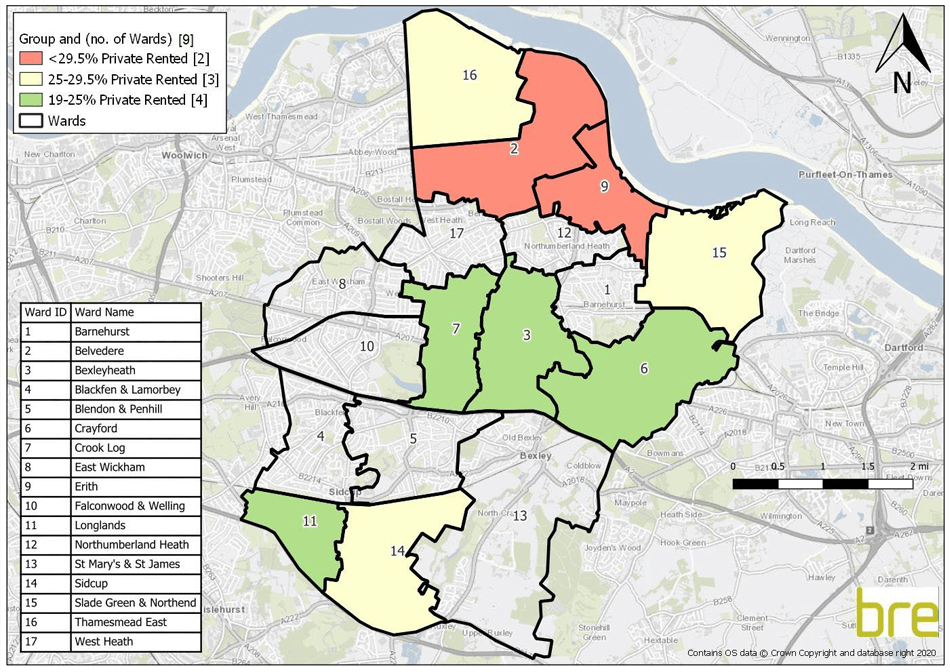
There are 9 (of a total of 17) wards with private rented proportions in excess of the national average (19%) - these are depicted in Table 3 by the thick dashed line.
Those wards with over 19% private rented stock have been further divided into 3 groups for analysis (depicted by the thin dashed lines in the table). These groups are as follows:
Wards with PRS over 30%
- Belvedere
- Erith
Wards with PRS between 25 to 30%
- Sidcup
- Thamesmead East
- Slade Green & Northend
Wards with PRS between 19 to 24% (above national average of 19%)
- Crayford
- Longlands
- Bexleyheath
- Crook Log
Table 3
Count and percentage of estimated privately rented dwellings by ward in Bexley (sorted by descending private rented proportion)
| Ward | Dwellings - all stock | Count (Dwellings - private rented) | Percentage (Dwellings - private rented) |
|---|---|---|---|
| Belvedere | 7,249 | 2,334 | 32% |
| Erith | 5,392 | 1,603 | 30% |
| Sidcup | 7,197 | 2,110 | 29% |
| Thamesmead East | 6,524 | 1,736 | 27% |
| Slade Green & Northend | 5,312 | 1,380 | 26% |
| Crayford | 6,893 | 1,403 | 20% |
| Longlands | 4,436 | 879 | 20% |
| Bexleyheath | 6,554 | 1,291 | 20% |
| Crook Log | 6,474 | 1,256 | 19% |
| Falconwood & Welling | 6,458 | 1,185 | 18% |
| St Mary's & St James | 4,665 | 845 | 18% |
| East Wickham | 6,280 | 966 | 15% |
| Northumberland Heath | 4,246 | 601 | 14% |
| Barnehurst | 4,711 | 664 | 14% |
| Blackfen & Lamorbey | 6,591 | 924 | 14% |
| Blendon & Penhill | 6,269 | 803 | 13% |
| West Heath | 6,138 | 521 | 8% |
The locations of each analysis group within Bexley are shown in Map 5, and are highlighted in either green, yellow or red depending on the percentage of PRS dwellings.
Map 5
Location of the three analysis groups with proportions of private rented stock which are greater than the national average (19%).
*The below image of Map 5 is not suitable for users of assistive technology (Screen reader) and does not allow users to zoom in without degrading visual quality. If you would like to understand any details about this map, please email rentitright@bexley.gov.uk
Information on property condition
Information on property condition is based on the presence of a category 1 HHSRS hazard (one or more of the 29 covered by the HHSRS13), a category 1 hazard for excess cold and a category 1 hazard for falls (these are fall hazards where the vulnerable person is over 60 and includes falls associated with baths, falling on the level and falling on stairs). Property condition also includes proportions of dwellings in disrepair. This is based on the former Decent Homes Standard and assesses the age of the dwelling and the condition of a range of building components, for example:
- walls
- roofs
- electrics and heating systems
Maps at COA level are provided for the private rented sector for the following housing standards variables in Map 6 to Map 9 further down:
- HHSRS
- the presence of a category 1 HHSRS hazard
- the presence of a category 1 hazard for excess cold
- the presence of a category 1 hazard for falls
- levels of disrepair
Table 4 Provides a summary of the property condition at ward level and is split into the groups described above based on the proportion of private rented stock in each ward. This table shows that the highest estimated levels of all hazards (12%), falls hazards (7%) and disrepair (7%) are in the Northumberland Heath ward. Both Sidcup ward and Northumberland Heath ward have an estimated 4% of PRS dwellings with excess cold.
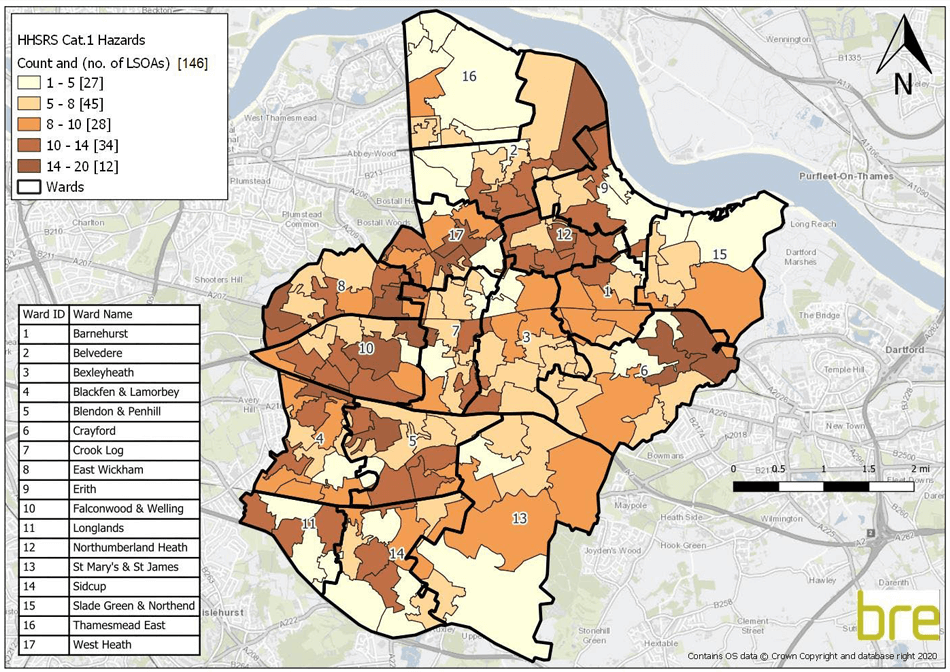
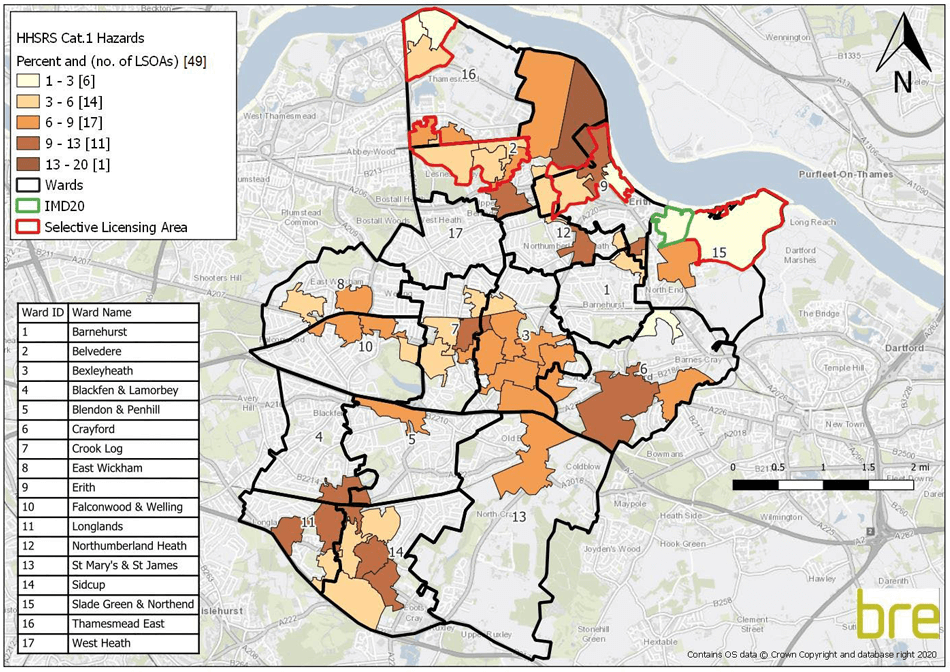
Map 6
Percentage of private rented sector dwellings in Bexley with the presence of a HHSRS category 1 hazard.
*The below image of Map 6 is not suitable for users of assistive technology (Screen reader) and does not allow users to zoom in without degrading visual quality. If you would like to understand any details about this map, please email rentitright@bexley.gov.uk
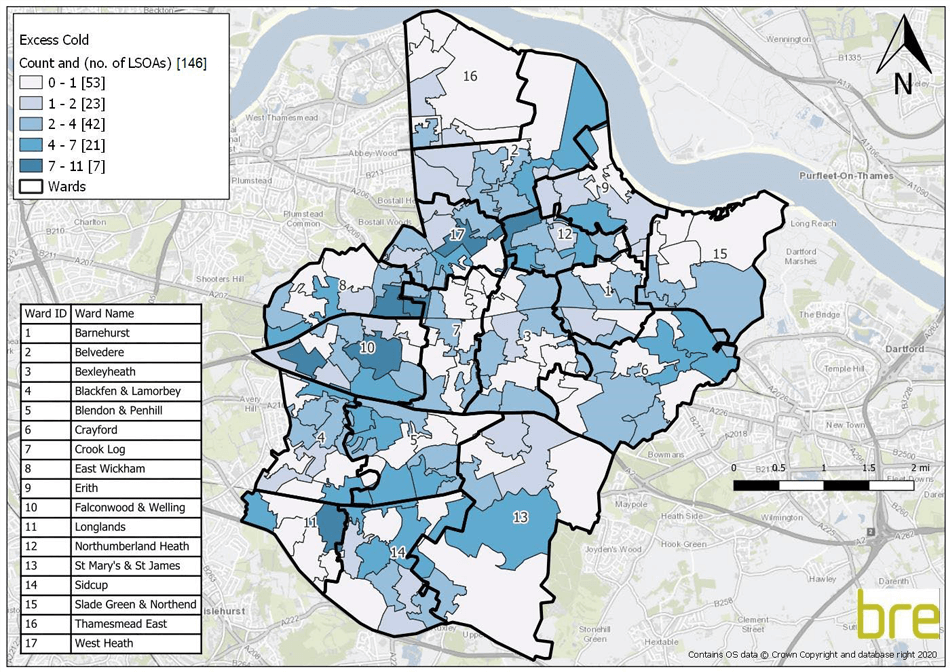
Map 7
Percentage of private rented sector dwellings in Bexley with the presence of an HHSRS category 1 hazard for excess cold.
*The below image of Map 7 is not suitable for users of assistive technology (Screen reader) and does not allow users to zoom in without degrading visual quality. If you would like to understand any details about this map, please email rentitright@bexley.gov.uk
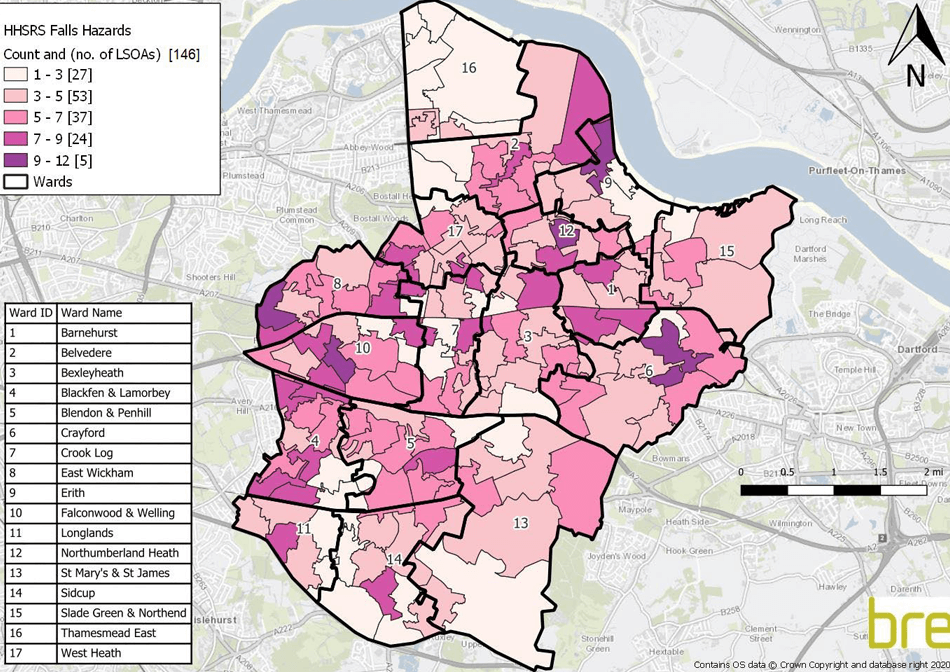
Map 8
Percentage of private rented sector dwellings in Bexley with the presence of a HHSRS category 1 hazard for falls.
*The below image of Map 8 is not suitable for users of assistive technology (Screen reader) and does not allow users to zoom in without degrading visual quality. If you would like to understand any details about this map, please email rentitright@bexley.gov.uk
Map 9
Percentage of private rented sector dwellings in Bexley in disrepair.
*The below image of Map 9 is not suitable for users of assistive technology (Screen reader) and does not allow users to zoom in without degrading visual quality. If you would like to understand any details about this map, please email rentitright@bexley.gov.uk
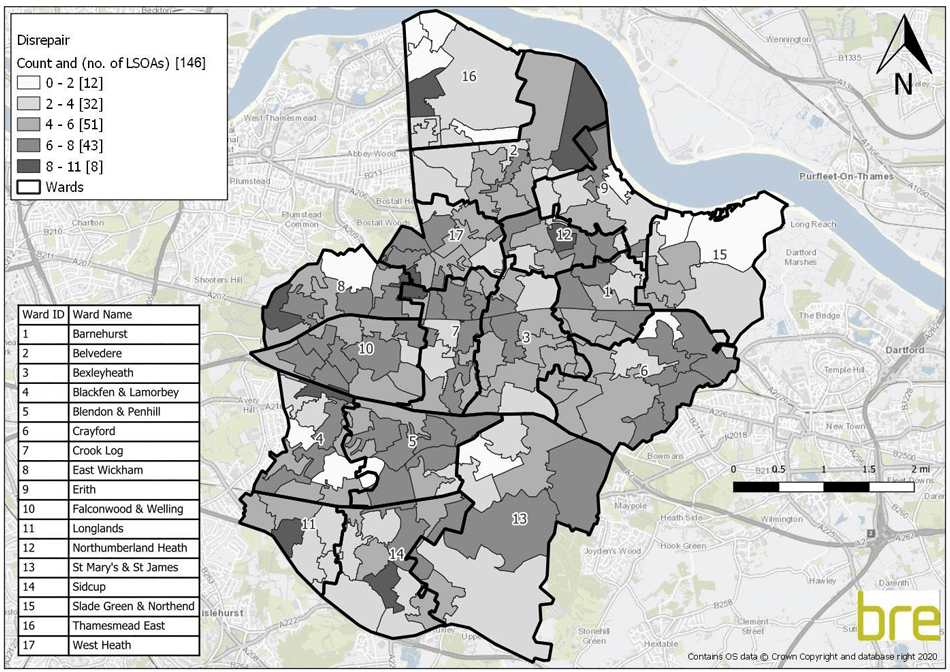
Table 4
Count and percentage of dwellings failing each of the HHSRS indicators and disrepair by ward, split into the 3 analysis groups, private rented stock
| Ward | Number of dwellings - private rented stock | HHSRS category 1 hazards - All hazards | HHSRS category 1 hazards - Excess cold | HHSRS category 1 hazards - Fall hazards | Disrepair |
|---|---|---|---|---|---|
| Belvedere | 2334 (-32%) | 181 (-8%) | 55 (-2%) | 125 (-5%) | 122 (-5%) |
| Erith | 1603 (-30%) | 97 (-6%) | 26 (-2%) | 68 (-4%) | 64 (-4%) |
| Sidcup | 2110 (-29%) | 176 (-8%) | 74 (-4%) | 76 (-4%) | 106 (-4%) |
| Thamesmead East | 1736 (-27%) | 74 (-4%) | 23 (-1%) | 49 (-3%) | 29 (-2%) |
| Slade Green & Northend | 1380 (-26%) | 82 (-6%) | 18 (-1%) | 64 (-5%) | 53 (-4%) |
| Crayford | 1403 (-20%) | 108 (-8%) | 34 (-2%) | 69 (-5%) | 73 (-5%) |
| Longlands | 879 (-20%) | 72 (-8%) | 28 (-3%) | 36 (-4%) | 48 (-5%) |
| Bexleyheath | 1291 (-20%) | 105 (-8%) | 31 (-2%) | 64 (-5%) | 71 (-5%) |
| Crook Log | 1256 (-19) | 96 (-8%) | 20 (-2%) | 66 (-5%) | 76 (-6%) |
| Falconwood & Welling | 1185 (-18%) | 122 (-10%) | 39 (-3%) | 67 (-6%) | 76 (-6%) |
| St Mary's & St James | 845 (-18%) | 60 (-7%) | 15 (-2%) | 35 (-4%) | 45 (-5%) |
| East Wickham | 966 (-15%) | 92 (-10%) | 28 (-3%) | 57 (-6%) | 55 (-6%) |
| Northumberland Heath | 601 (-14%) | 72 (-12%) | 24 (-4%) | 43 (-7%) | 41 (-7%) |
| Barnehurst | 664 (-14%) | 60 (-9%) | 15 (-2%) | 37 (-6%) | 35 (-5%) |
| Blackfen & Lamorbey | 924 (-14%) | 82 (-9%) | 26 (-3%) | 48 (-5%) | 51 (-6%) |
| Blendon & Penhill | 803 (-13%) | 83 (-10%) | 23 (-3%) | 51 (-6%) | 50 (-6%) |
| West Heath | 521 (-8%) | 54 (-10%) | 15 (-3%) | 32 (-6%) | 30 (-6%) |
Analysis of property conditions in the private rented sector for the analysis groups
This section analyses the proportion of private rented dwellings:
- with a category 1 Housing Health and Safety Rating System (HHSRS) hazard – this is the presence of one or more of the 29 hazards covered by the HHSRS (see Appendix A for more information)
- with a category 1 hazard for excess cold
- with a category 1 HHSRS fall hazard - these include those fall hazards where the vulnerable person is 60 or over, i.e. the presence of falls associated with baths, falling on the level and falling on stairs
- in disrepair - this is based on the former Decent Homes Standard criteria for disrepair which states that a dwelling fails this criterion if it is not found to be in a reasonable state of repair. This is assessed by looking at the age of the dwellings and the condition of a range of building components (including walls, roofs, windows, doors, electrics and heating system)
Figure 5 to Figure 7 compare these property condition indicators across the three analysis groups. For wards with over 30% of the stock being private rented, Belvedere has the highest level of all four variables including category 1 hazards (7.8%), excess cold (2.4%), falls hazard (5.4%) and disrepair (5.2%). Compared to the overall figures for Bexley’s private rented stock, Belvedere generally tends to have similar or higher levels of each of the property condition indicators, whereas Erith has lower levels than Bexley’s average for all of the variables.
Of the wards where 25 to 30% of the stock is estimated to be private rented, Sidcup has the highest levels of all hazards (8.3%), excess cold (3.5%) and disrepair (5.0%) and Slade Green & Northend has the highest levels of fall hazard (4.6%). Compared to Bexley’s overall private rented stock, Sidcup has slightly higher levels off all hazards and higher levels of excess cold, but lower levels of falls hazards and the same level of disrepair. Whereas Thamesmead East and Slade Green & Northend have lower levels for all four variables in comparison to Bexley’s overall private rented stock.
For the wards with 19 to 24% private rented stock, Longlands has the highest levels of all hazards (8.2%) and excess cold (3.2%), whereas Crook Log has the highest levels of disrepair (6.1%) and falls hazard (5.3%). Compared to Bexley’s overall private rented stock, Longlands has slightly higher levels of excess cold and slightly lower levels of falls hazard, but all other wards display very similar results to that of Bexley’s average.
Figure 5
Comparison of percentage of private rented dwellings failing the Housing Standards Variables for Wards with PRS over 30%
| Category | Belvedere | Erith | Bexley private rented overall |
|---|---|---|---|
| HHSRS category 1 hazards | 7.8% | 6.1% | 8.0% |
| HHSRS excess cold | 2.4% | 1.6% | 2.0% |
| HHSRS falls | 5.4% | 4.2% | 5.0% |
| Disrepair | 5.2% | 4.0% | 5.0% |
Figure 6
Comparison of percentage of private rented dwellings failing the Housing Standards Variables for Wards with PRS 25 to 30%.
| Category | Sidcup | Thamesmead East | Slade Green & Northend | Bexley private rented overall |
|---|---|---|---|---|
| HHSRS category 1 hazards | 8.3% | 4.3% | 5.9% | 8.0% |
| HHSRS excess cold | 3.5% | 1.3% | 1.2% | 2.0% |
| HHSRS falls | 3.6% | 2.8% | 4.6% | 5.0% |
| Disrepair | 5.0% | 1.7% | 3.8% | 5.0% |
Figure 7
Comparison of percentage of private rented dwellings failing the Housing Standards Variables for Wards with PRS 19 to 24%
| Category | Crayford | Longlands | Bexleyheath | Crook log | Bexley private rented |
|---|---|---|---|---|---|
| HHSRS category 1 hazards | 7.7% | 8.2% | 8.1% | 7.6% | 8.0% |
| HHSRS excess cold | 2.4% | 3.2% | 2.4% | 1.6% | 2.0% |
| HHSRS falls | 4.9% | 4.1% | 5.0% | 5.3% | 5.0% |
| Disrepair | 5.2% | 5.5% | 5.5% | 6.1% | 5.0% |
Information on crime - ASB (antisocial behaviour)
ASB covers a range of activities which negatively affect people on a daily basis14. ASB is defined as “behaviours by a person which causes or is likely to cause harassment, alarm or distress to one or more persons not of the same household as the person” and is classified under 3 headings:
- Personal - ASB is perceived to be targeted at an individual or group rather than the community at large
- Nuisance - ASB is causing trouble, annoyance or suffering to the community at large rather than an individual or group
- Environmental - the incident is not aimed at an individual or group but targets the wider environment e.g. public spaces/buildings
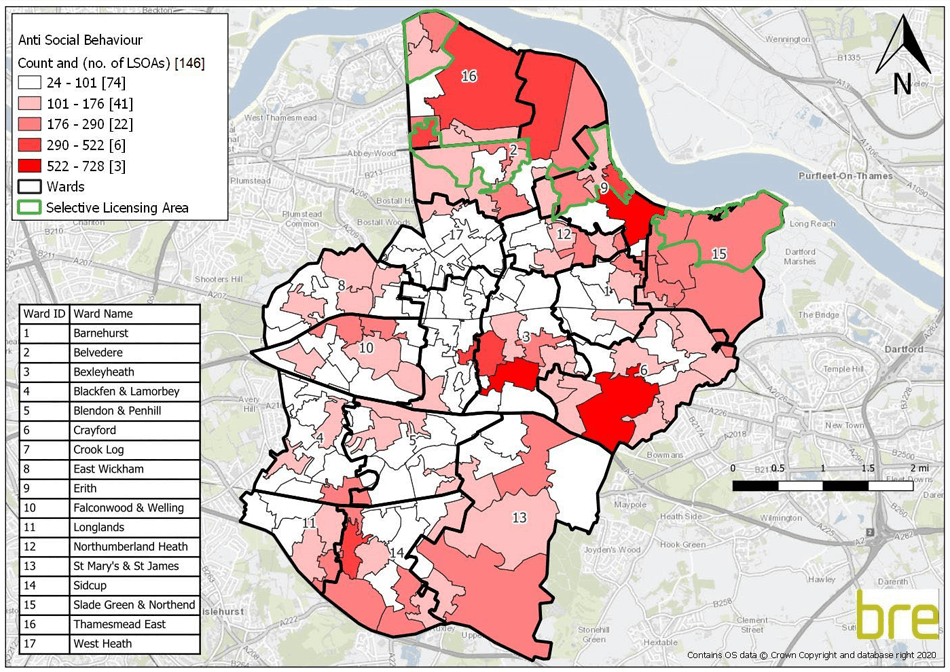
Information was sourced from data.police.uk for 2020 to 2022 and this is summarised in Figure 8 which shows incidents of ASB by ward for all three years15. For 2020 there are two wards with much higher numbers of reported ASB incidents than other parts of Bexley. These are Belvedere (670 incidents in 2020) and Crayford (696 incidents in 2020), however the cases of ASB in both wards drastically reduced in 2021, where there were 505 recorded ASB instances in Belvedere (a reduction of 25%) and 489 recorded ASB instances in Crayford (a reduction of 30%). As shown earlier in the report with the noise nuisance data, it is possible that instances of ASB were especially high in 2020 compared to other years as a result of the pandemic as generally, in 2021 incidents of ASB in all wards except Bexleyheath appear to have reduced compared to 2020. Additionally, the available 2022 data indicates that a similar pattern is continuing in 2022, with the highest instances of ASB currently in Bexleyheath, Belvedere and Crayford, but with an overall number of ASB incidents more comparable to 2021 than 2020. Map 10 shows the figures at LSOA level for 2020, indicating higher levels of ASB incidents to the south and south west of the borough.
Figure 8
Incidences of ASB by ward, 2020, 2021 and 2022
Source - data.police.uk
| Ward | Number of ASB incidents - 2020 | Number of ASB incidents - 2021 | Number of ASB incidents - 2022 |
|---|---|---|---|
| Barnehurst | 325 | 186 | 110 |
| Belvedere | 670 | 505 | 286 |
| Bexleyheath | 525 | 538 | 344 |
| Blackfen & Lamorbey | 382 | 273 | 176 |
| Blendon & Penhill | 317 | 196 | 73 |
| Crayford | 696 | 489 | 257 |
| Crook Log | 491 | 284 | 137 |
| East Wickham | 456 | 259 | 153 |
| Erith | 549 | 455 | 232 |
| Falconwood & Welling | 467 | 295 | 152 |
| Longlands | 330 | 250 | 113 |
| Northumberland Heath | 359 | 219 | 138 |
| Sidcup | 490 | 331 | 168 |
| Slade Green & Northend | 409 | 297 | 250 |
| St Mary's & St James | 326 | 254 | 121 |
| Thamesmead East | 646 | 521 | 247 |
| West Heath | 223 | 160 | 144 |
Map 10
Distribution of ASB by LSOA - 2021 figures
Source - data.police.uk
*The below image of Map 10 is not suitable for users of assistive technology (Screen reader) and does not allow users to zoom in without degrading visual quality. If you would like to understand any details about this map, please email rentitright@bexley.gov.uk
Information on deprivation
The 2019 Indices of Multiple Deprivation (IMD)16 take account of seven “domains” to produce an overall relative measure of deprivation. The domains and their weighting are as follows:
- income deprivation (22.5%)
- employment deprivation (22.5%)
- education, skills and training deprivation (13.5%)
- health deprivation and disability (13.5%)
- crime (9.3%)
- barriers to housing and services (9.3%)
- living environment deprivation (9.3%)
The indices are produced at Lower Super Output Area (LSOA) and provide statistics on relative deprivation in England by ranking every LSOA from 1 (most deprived) to 32,844 (least deprived). To determine whether an area is deprived or not for the purposes of this study, the 20% most deprived LSOAs have been used.
Map 11
Map 11 shows the distribution of deprivation across Bexley at LSOA level with the wards shown over the top. The darker colours indicate the most deprived areas, for example, looking at the key there are 9 LSOAs which fall into the 20% most deprived areas in England. Overall, in Bexley 6% of privately rented properties are in the 20% most deprived areas.
Distribution of deprivation in Bexley
Source - DLUHC, Indices of Deprivation 2019
*The below image of Map 11 is not suitable for users of assistive technology (Screen reader) and does not allow users to zoom in without degrading visual quality. If you would like to understand any details about this map, please email rentitright@bexley.gov.uk
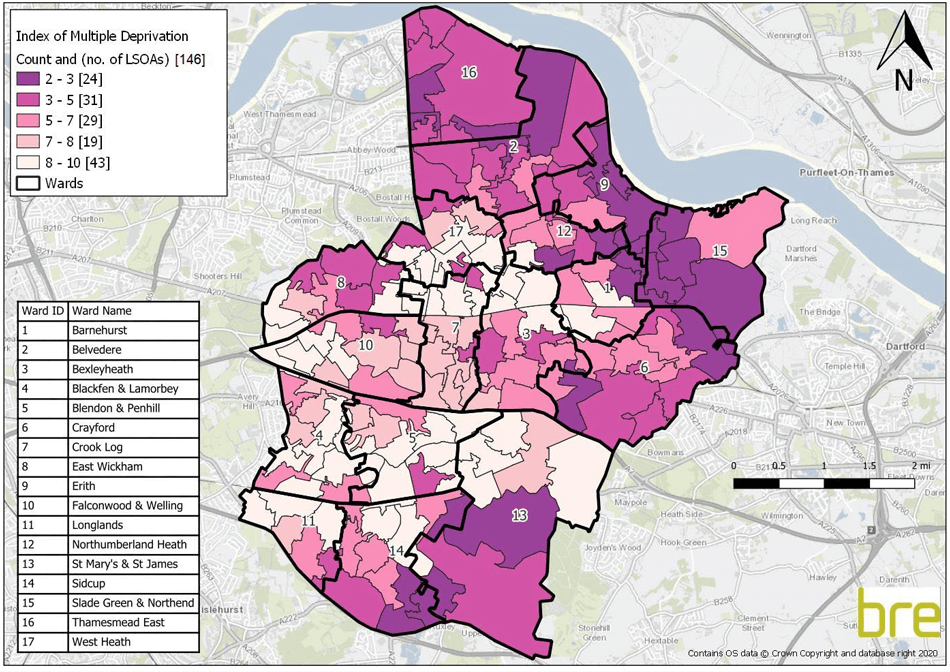
Index of Multiple Deprivation:
- 1 to 2 = the 10% and 20% deciles (i.e. the most deprived), 3 = the 30% decile
Figure 9
Figure 9 shows the results of this analysis of Index of Multiple Deprivation (IMD) data at ward level. In Slade Green & Northend 52% of private sector dwellings are in the 20% of the most deprived LSOAs in England. There are a further five wards with private sector dwellings in the 20% most deprived LSOAs in England including Thamesmead East (7%) and Barnehurst (18%), Crayford (6%), and Bexleyheath (1%) and Sidcup (5%).
Percentage of privately rented dwellings in each ward in Bexley which are in the 20% most deprived areas in England (IMD 2019):
Information on migration
Data on migration is available for all London boroughs17, therefore migration figures for Bexley have been compared to the largest 10 largest London boroughs as well as England overall for the latest year available (mid-2019 to mid-2020) - see Figure 10 below. The data uses the long-term18 international and internal (within UK) migration component of population change data to calculate the rates for turnover and is therefore split into international migration and internal migration. The data shows that for international migration the greatest turnover rate is in Newham, with Bexley having the second lowest turnover of the analysed cities. Looking at internal migration, Bexley has the second lowest levels, with Wandsworth and Lambeth having the greatest levels of internal migration.
Figure 10
Comparison of migration figures (international and internal) for Bexley, the largest boroughs in London, and England overall - mid-2019 to mid-2020.
Source - ONS17 (Office for National Statistics)
Migration figures for Bexley and the largest boroughs in London
| Ward | Turnover rate per thousand resident population (International migration) | Turnover rate per thousand resident population (Internal migration) |
|---|---|---|
| Bexley | 7 | 99 |
| Croydon | 15 | 121 |
| Barnet | 28 | 122 |
| Ealing | 36 | 151 |
| Newham | 46 | 144 |
| Brent | 41 | 155 |
| Bromley | 7 | 105 |
| Enfield | 17 | 107 |
| Wandsworth | 33 | 211 |
| Lambeth | 41 | 215 |
| Greenwich | 21 | 140 |
| Westminster | 112 | 138 |
| Kensington and Chelsea | 47 | 145 |
| Hammersmith and Fulham | 55 | 212 |
| Southwark | 49 | 186 |
Migration figures for England
| Country | Turnover rate per thousand resident population (International migration) | Turnover rate per thousand resident population (Internal migration) |
|---|---|---|
| England | 15 | 4 |
In-depth analysis on specific areas
Areas with proportions of private rented stock above the national average (19%) were examined more closely. Table 5 shows the numbers and percentages of dwellings for each of the HHSRS indicators, dwellings in disrepair and the most deprived 20% of LSOAs in England (IMD 2019) by ward. The table is divided into the previously identified three analysis groups (all above the national average of 19% private rented stock), and also provides the figures for the remaining wards for completion of information.
Looking at the analysis group with over 30% private rented sector stock, Belvedere ward has the highest proportion of private rented sector dwellings (32%). Of the two wards in this analysis group, it is Belvedere that performs worst for all hazards (8% compared to Erith’s 6%), fall hazards (5% compared to 4%) and disrepair (5% compared to 4%). Both wards have the same proportions of excess cold (2%) and it is only Erith that has a very small number of dwellings in the most deprived 20% of LSOAs in England.
For the analysis group with 25 to 30% private rented stock, it is Sidcup that performs worst for all hazards (8%), excess cold (4%) and disrepair (5%), but Slade Green & Northend performs worst for fall hazards (5%). All three wards in this analysis group have some degree of dwellings in the most deprived 20% of LSOAs, with 5% in Sidcup, 7% in Thamesmead East and 52% in Slade Green & Northend.
Looking at the analysis group with 19 to 24% private rented stock, all four wards have 8% of their PRS stock with all hazards, whereas Longlands has the highest levels of excess cold (3%), the highest levels of falls hazards are found in Crayford, Bexleyheath and Crook Log (all with 5%) and the highest levels of disrepair are found in Crook Log (6%). Of this analysis group, it is only Crayford that has any dwellings (6%) within the most deprived 20% of LSOAs in England.
To provide a more detailed picture, the following maps provide LSOA level information where only LSOAs where the proportion of private rented dwellings is greater than the national average (19%) are shown.
Map 12 shows the levels of HHSRS category 1 hazards in these specific areas. The rest of the map is blank, showing it is not an LSOA with greater than 19% private rented stock. This provides more focus on smaller geographical areas where private rented stock is high, and the proportion of hazards is also high. For example, the map shows the parts of Erith ward with a private rented stock over 19% as well as showing that one LSOA has 13% to 20% of properties with a category 1 hazard. Part of St Mary’s & St James ward shows as having 1% to 3% category 1 hazards as well as being highlighted in green, which means this area is also in the 20% most deprived LSOAs
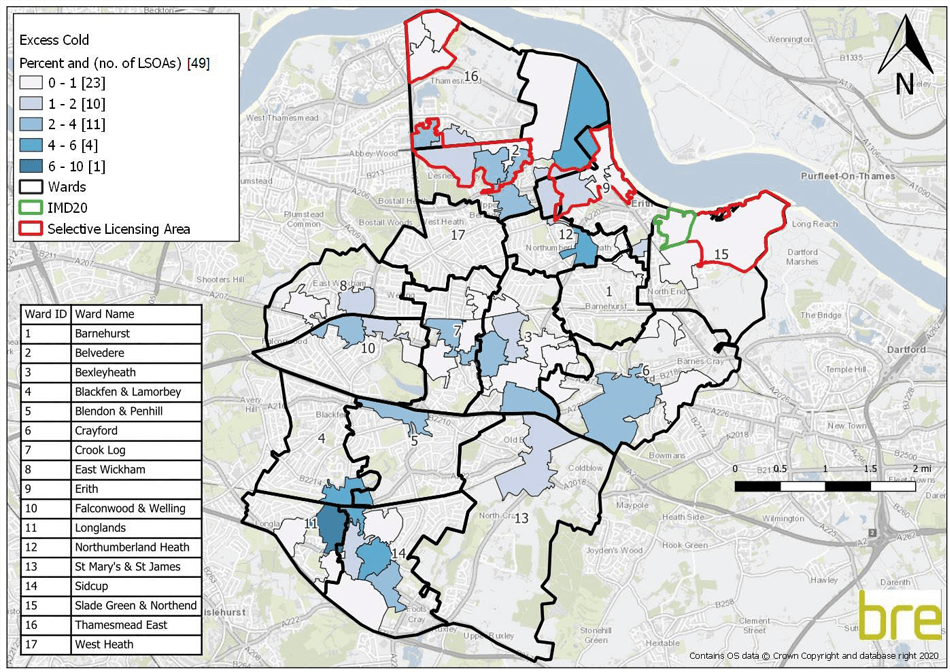
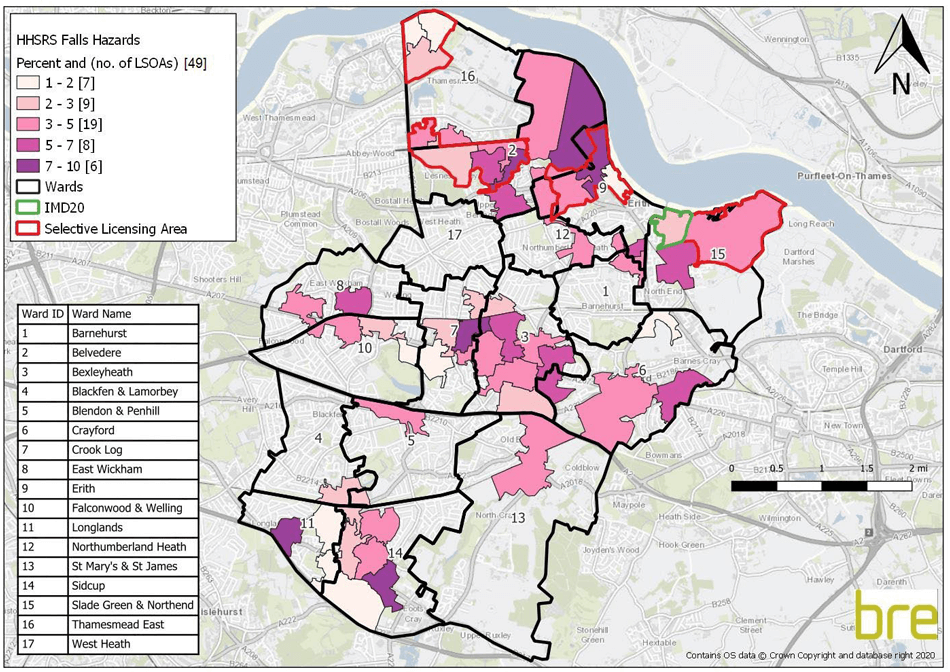
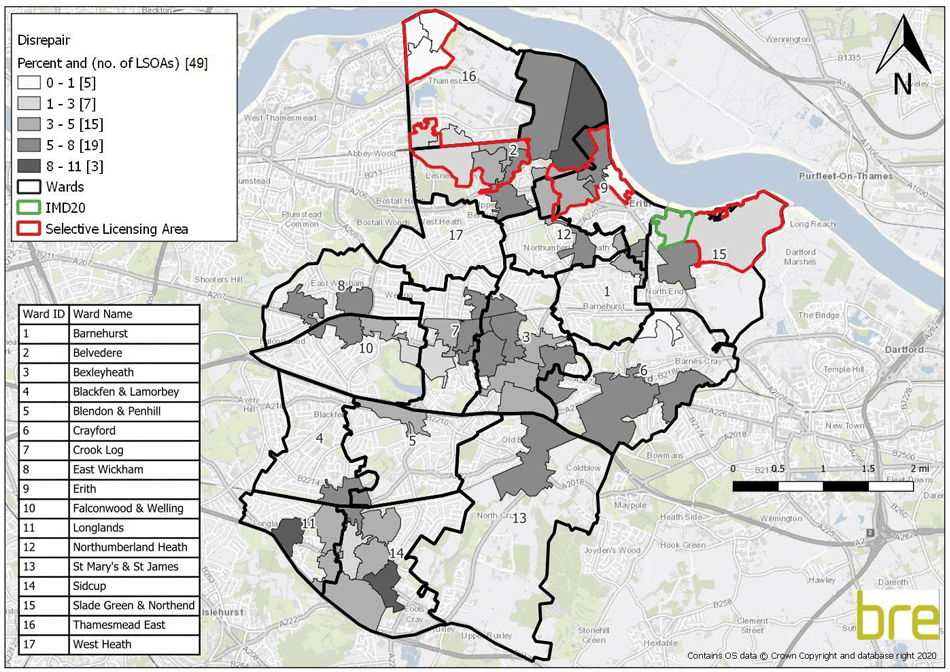
Map 12 to Map 15 show the distributions for excess cold, fall hazards and disrepair across Bexley in LSOAs where the proportion of private rented dwellings is greater than the national average. For excess cold, most of the areas which stand out are similar to those for category 1 hazards. The maps show Erith, Longlands and Bexleyheath to consistently be the worst performing across these maps and therefore areas to target for improvements. In addition, St Mary and St James is another area with high levels of PRS homes and also certain LSOAs within the 20% most deprived, so this is potentially another area to target for improvements
Table 5
Number and percentage of dwellings for each of the HHSRS indicators, disrepair and the most deprived 20% of LSOAs in England (IMD 2019) by ward - private rented stock split into the three analysis groups with over 19% private rented stock (remaining wards included for completeness)
| Ward | Number of dwellings - private rented stock | HHSRS category 1 hazards - All hazards | HHSRS category 1 hazards - Excess cold | HHSRS category 1 hazards - Fall hazards | Disrepair | Index of Multiple Deprivation (20%) |
|---|---|---|---|---|---|---|
| Belvedere | 2334 (-32%) | 181 (-8%) | 55 (-2%) | 125 (-5%) | 122 (-5%) | 0 (0%) |
| Erith | 1603 (-30%) | 97 (-6%) | 26 (-2%) | 68 (-4%) | 64 (-4%) | 7 (0%) |
| Sidcup | 2110 (-29%) | 176 (-8%) | 74 (-4%) | 76 (-4%) | 106 (-5%) | 105 (-5%) |
| Thamesmead East | 1736 (-27%) | 74 (-4%) | 23 (-1%) | 49 (-3%) | 29 (-2%) | 125 (-7%) |
| Slade Green & Northend | 1380 (-26%) | 82 (-6%) | 18 (-1%) | 64 (-5%) | 53 (-4%) | 714 (-52%) |
| Crayford | 1403 (-20%) | 108 (-8%) | 34 (-2%) | 69 (-5%) | 73 (-5%) | 88 (-6%) |
| Longlands | 879 (-20%) | 72 (-8%) | 28 (-3%) | 36 (-4%) | 48 (-5%) | 0 (-0%) |
| Bexleyheath | 1291 (-20%) | 105 (-8%) | 31 (-2%) | 64 (-5%) | 71 (-5%) | 5 (0%) |
| Crook Log | 1256 (-19%) | 96 (-8%) | 20 (-2%) | 66 (-5%) | 76 (-6%) | 0 (0%) |
| Falconwood & Welling | 1185 (-18%) | 122 (-10%) | 39 (-3%) | 67 (-6%) | 76 (-6%) | 2 (0%) |
| St Mary's & St James | 845 (-18%) | 60 (-7%) | 15 (-2%) | 35 (-4%) | 45 (-5%) | 0 (0%) |
| East Wickham | 966 (-15%) | 92 (-10%) | 28 (-3%) | 57 (-6%) | 55 (-6%) | 0 (0%) |
| Northumberland Heath | 601 (-14%) | 72 (-12%) | 24 (-4%) | 43 (-7%) | 41 (-7%) | 0 (0%) |
| Barnehurst | 664 (-14%) | 60 (-9%) | 15 (-2%) | 37 (-6%) | 35 (-5%) | 121 (-18%) |
| Blackfen & Lamorbey | 924 (-14%) | 82 (-9%) | 26 (-3%) | 48 (-5%) | 51 (-6%) | 0 (0%) |
| Blendon & Penhill | 803 (-13%) | 83 (-10%) | 23 (-3%) | 51 (-6%) | 50 (-6%) | 0 (0%) |
| West Heath | 521 (-8%) | 54 (-10%) | 15 (-3%) | 32 (-6%) | 30 (-6%) | 0 (0%) |
Map 12
Distribution of category 1 HHSRS hazards where the proportion of private rented stock is above the national average (N.B. the green highlighted LSOAs show the most deprived 20% - Source DLUHC Indices of Deprivation 2019, and the red highlighted areas show the Selective Licensing scheme)
*The below image of Map 12 is not suitable for users of assistive technology (Screen reader) and does not allow users to zoom in without degrading visual quality. If you would like to understand any details about this map, please email rentitright@bexley.gov.uk
Map 13
Distribution of excess cold hazards where the proportion of private rented stock is above the national average (N.B. the green highlighted LSOAs show the most deprived 20% - Source DLUHC Indices of Deprivation 2019, and the red highlighted areas show the Selective Licensing scheme)
*The below image of Map 13 is not suitable for users of assistive technology (Screen reader) and does not allow users to zoom in without degrading visual quality. If you would like to understand any details about this map, please email rentitright@bexley.gov.uk
Map 14
Distribution of fall hazards where the proportion of private rented stock is above the national average (N.B. the green highlighted LSOAs show the most deprived 20% - Source DLUHC Indices of Deprivation 2019, and the red highlighted areas show the Selective Licensing scheme)
*The below image of Map 14 is not suitable for users of assistive technology (Screen reader) and does not allow users to zoom in without degrading visual quality. If you would like to understand any details about this map, please email rentitright@bexley.gov.uk
Map 15
Distribution of dwellings in disrepair where the proportion of private rented stock is above the national average (N.B. the green highlighted LSOAs show the most deprived 20% - Source DLUHC Indices of Deprivation 2019, and the red highlighted areas show the Selective Licensing scheme)
*The below image of Map 15 is not suitable for users of assistive technology (Screen reader) and does not allow users to zoom in without degrading visual quality. If you would like to understand any details about this map, please email rentitright@bexley.gov.uk
Footnotes:
6 Selective licensing of private rented housing in England and Wales
9 English Housing Survey Headline Report, 2018 to 2019
10 For a full list of hazards see - Housing Health and Safety Rating System Operating Guidance, ODPM, 2006
11 English indices of deprivation 2019
12 English Housing Survey - Headline Report, 2018-19
13 For a full list of hazards see - Housing Health and Safety Rating System Operating Guidance, ODPM, 2006
14 Antisocial Behaviour Act 2003 & Police Reform and Social Responsibility Act 2011
15 Data for 2022 was available from January until August, so whilst this data has been included in the figure, it has not been included in the corresponding text analysis as there is not a full year available to provide a fair comparison
16 English indices of deprivation 2019
17 ONS - Local area migration indicators, UK
18 A person who moves from their country of usual residence for a period of at least 12 months - International migration statistics first time user guide